Indexed Linked Gilts & Liability Driven Investment
Tuesday, 10 May 2022By Con Keating & Jon Spain
Introduction
The majority of the discussion about index linked gilts (ILGs) has tended to be highly technical in nature. Topics have included the differences between three and eight-month lags in indexation, convexity, revaluation factors, break-evens, Z-scores and the inevitable Greek, Iota. For most, little of this is intuitive. More recently, attention has focussed on the revisions to the Retail Price Index (RPI) formulation which will make its calculation that of CPIH (Consumer Price Index including owner occupiers housing costs). The issue in that debate is the lower rate expected from the CPIH formulation to that expected of RPI. It seems that there is something of an actuarial consensus that for modelling purposes this should be considered to be 1% annually. We have conducted extensive analysis of the historic data and believe that the long run difference has been, and is likely to remain, 0.72 %. That may appear trivial, but at 50 years out it is a 15% difference in capital values. It is a major saving for government finances coming at a cost to the holders of ILGs, who are mainly defined benefit pension schemes. Over the remaining life of the existing stock of ILGs, this saving may be estimated to be between £90 and £120 billion at current market prices. The market response to this shift of index construction has been surprising; no discernible decline in prices reflecting the lower future revaluation.
Some have focussed on another aspect of ILGs, their value for money. With linkers having traded at RPI minus 2.5% - 3%, it is clear that they have been very expensive indeed. With inflation at the Bank of England’s upper level of 2%, their expected returns have at times been negative. (Expected negative returns should be challenging for the concepts of investment and fiduciary duty, both of which figure prominently in the value for money discussion.) Fortunately, there is one intuitive metric, the breakeven yield; that is the rate of future inflation needed over the life to the linker to warrant today’s price. Figure 1 below shows the recent evolution of the breakeven yield, in nominal terms, for a range of different maturity linkers.
Figure 1: Breakeven Yields
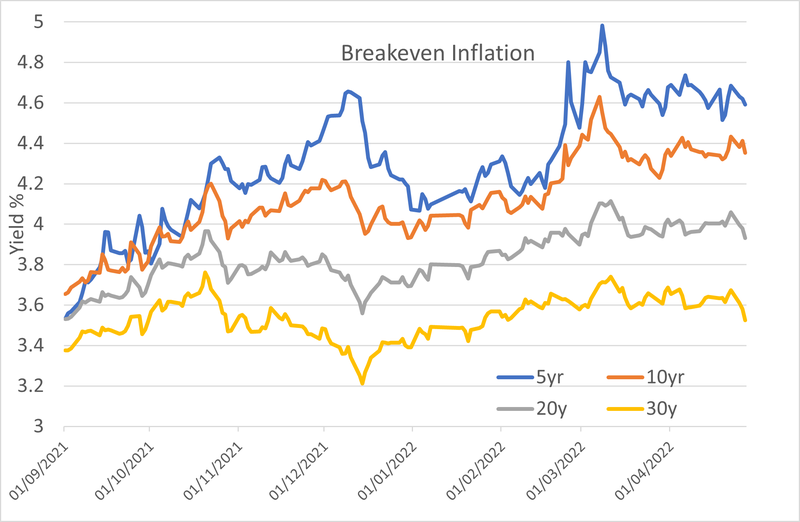
In terms of value for money, we simply need to decide how these rates compare with what we expect. This brief period of time when the retail prices index rose sharply, is reflected in the overall upward shift in the breakeven rates, and there is a pronounced widening of the range of these rates. At the narrowest, this was 28 basis points and at the widest, 128 basis points. Note also that there are periods when the breakeven for short maturities was rising, while for long maturities it was falling
Index-linked gilts can be extremely volatile and the empirical evidence for this shows that the 1/8% 2052 Treasury has exhibited price volatility of 23% pa over the past year. This is greater than UK equity. There is also a term structure of volatility with longer dated issues being more volatile than the shorter dated issues. We illustrate this in table 1 with the maximum drawdown over the past year of a selection of issues. For comparability, these are all 1/8th% coupons, though coupon effects are rather small. Maximum drawdown is the largest price decline evident within a period.
Table 1: Maximum Drawdown of selected ILGs
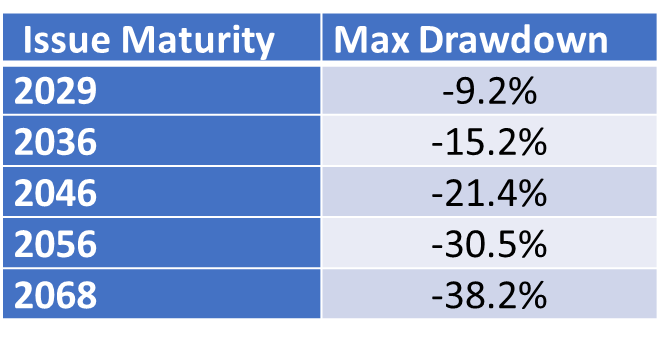
From table 1, it is clear that ILGs can be extremely volatile, more so than UK equity at maturities beyond about 20 years. With coupons as small as 1/8th of one percent, these are effectively zero-coupon bonds, with very much larger future payoffs than conventional issues of the same term.
ILGs and Liability Driven Investment
Index-linked gilts have become a staple of liability driven investment, which is concerned with hedging the variation of assets and liabilities from valuation to valuation. It is obvious that index linked gilts would have little value in matching the term structure of pension payments of a DB pension scheme – the peppercorn coupons would have very little value there.
Figure 2: ILG 15+ Index Returns and RPI Changes
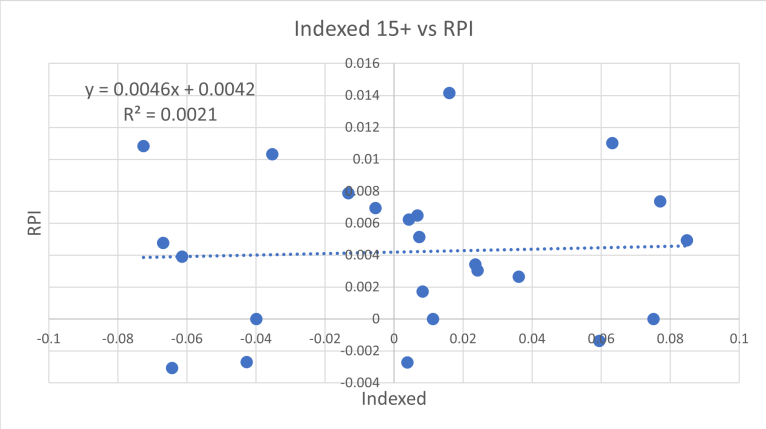
From Figure 2, it is clear that there is no relationship between ILG 15+ returns and change to the RPI. Index linked gilts would therefore have been useless at offsetting the RPI-related cost effects of DB scheme valuations, though they will return an inflation-equivalent principal amount at maturity.
The recent situation with USS makes an interesting case study in this respect. At the time of their 2020 valuation, they reported £20 billion of inflation indexed investments and by 2021 this had risen to £30 billion. Now not all of these are ILGs, some may be corporate and other linkers. However, given the small size of the non-gilt linker market, it seems plausible that 80% or more of these holdings are ILGs. Moreover, as linker indices only rose by 3.6% over the 2020-2021 period, it is clear that USS were buying substantial amounts of ILGs, and buying many with borrowed money, i.e. via leverage. This view is reinforced by an increase in the indebtedness of USS as the scheme’s leverage rose from 13.3% in 2020 to 18.3% in 2021. USS are proposing to increase the leverage further to 37% from 2021’s 18.3% in order to ‘hedge’ 40% each of their inflation and interest rate exposure, which they report, in the VIS Q&A document, as being 28% and 34% currently. There is a problem with these figures, to which we will revert later.
It is interesting that USS make little use of inflation derivatives - they report just £334 million - although the scheme uses derivatives extensively in the ‘hedging’ of interest rate exposure. Unlike ILGs, inflation derivatives can be constructed to marry the inflation exposure term profile of DB schemes.
The question which must be addressed is what does drive ILG prices. Figure 3 shows the evolution of the FTSE over-15-year conventional and index linked gilts indices over the period from March 2020, the date of the last USS valuation.
Figure 3: Conventional Gilts, Index Linked Gilts and RPI
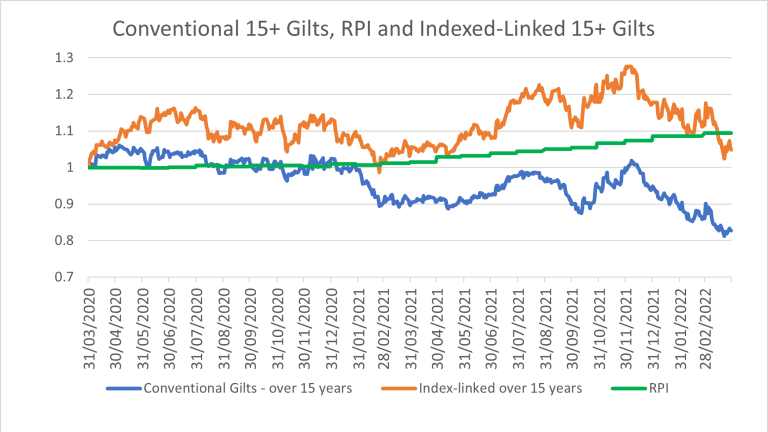
Inspection of the presentation of Figure 3 offers little by way of evidence. Figure 4 presents a comparison of the returns of the two series:
Figure 4: ILG Returns vs Conventional 15+ Returns
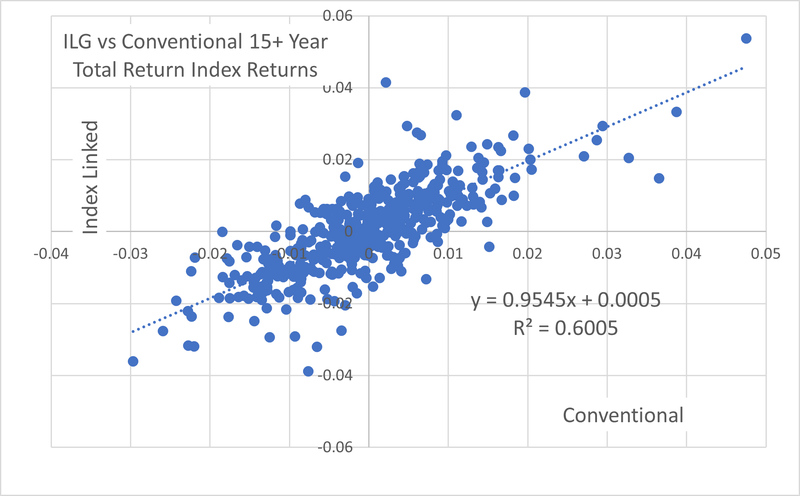
From Figure 4 we see that there is a strong relationship between ILG and conventional bond returns. If we examine individual pairings, such as the benchmark 1.25% thirty year conventional and the 0.25% 2052, we see results as strong or stronger – the correlation in that case is 0.88. The full sample returns distributions are shown as Figure 5
Figure 5 Distributions of ILG and Conventional Index Returns
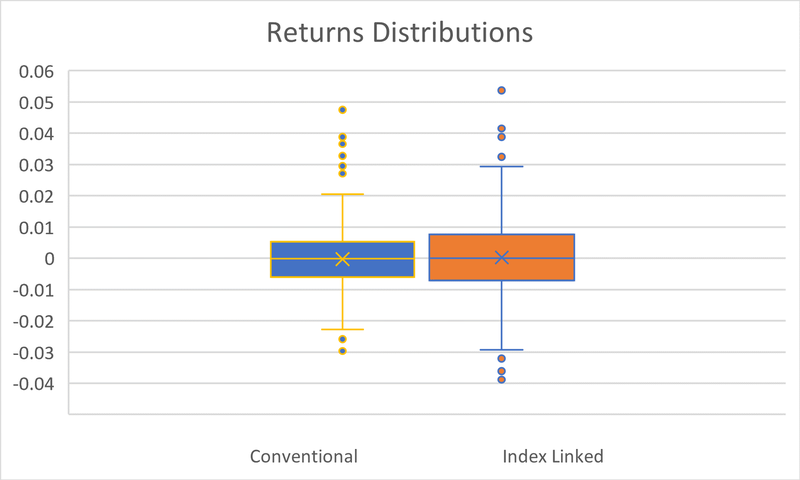
The annualised ILG and conventional returns are respectively 5.4% and minus 8.0%. The standard deviations, respectively 18.6% and 15.1%.
The overall Beta of the ILG index returns to conventional gilt index returns as shown above (Figure 4) is 0.95 but this hides much variation within that two-year sample set. A three-month rolling Beta shows a minimum of 0.8 and a maximum of 1.14 within this two-year period. The low value arises in the first quarter, March – June 2020, when the annualised returns and standard deviations were, for the ILG index, 3.7% and 13.8%, and for the conventional, 1% and 13.1%. This was the period of lowest volatility, which is perhaps surprising as this was the time of the rapid recovery of equity markets from the pandemic panic sell-off. The final quarter, January – March 2022, had the highest Beta (1.14) and also the highest annualised volatility, respectively 20.0% and 26.3% for the conventional and index linked. The annualised returns for this quarter are -3.2% for the conventional and – 2.1% for the index linked.
Given the weakness of ILGs as a hedging instrument for retail price inflation, the obvious question is whether there may have been a superior hedge available. We therefore examine the relationship between RPI and ILGs and inverted conventional prices, as set out in Figure 6. The inverted conventional price is simply the price receivable by a short-seller of the conventional gilt.
Figure 6: RPI, ILG and Conventional Gilts
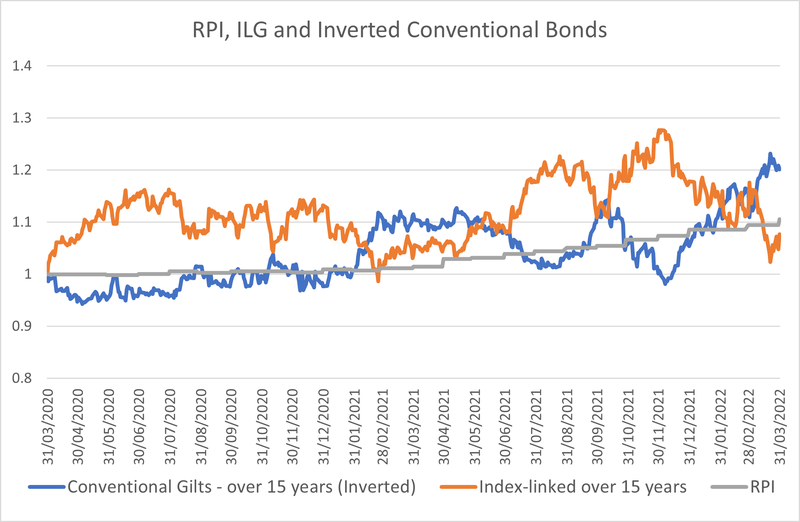
The correlation between the ILG and RPI here is 0.46%. The inverted gilt index (a short position) has a correlation of 0.68. This is simply recognition that as inflation rises interest rates also tend to rise, and bond prices fall. In the context of the overall LDI strategy, where conventional gilts are being bought to hedge the effects of discount rate changes, this is problematic.
Let us be absolutely clear, buying a linker is in effect an indirect way of buying a (sometimes very) long (conventional) gilt exposure. As interest rates rise, the linker and the long gilt will both rise in yield and their prices will fall. When inflation and rates rise, the usual relation predicted in theory and proven empirically, is that both instruments will show losses. However, the linker losses may be catastrophic in practice, as was illustrated by the sequence of declines since December 2021, and in Table 1 earlier. At the same time, while this relationship is playing out, what is happening is that the actual liabilities, the future pensions payable, are rising to reflect inflation, according to scheme rules. The strategy of buying index-linked gilts to hedge the interim variability of valuations due to inflation and of borrowing money to fund these purchases seems more likely to exacerbate than remedy deficit problems.
Figure 7, below, shows the magnitude of the error term arising from the use of index linked gilts, that is the difference between the cumulative inflation effects and linker index prices. It is very substantial.
Figure 7: Error Term (Linker minus RPI)
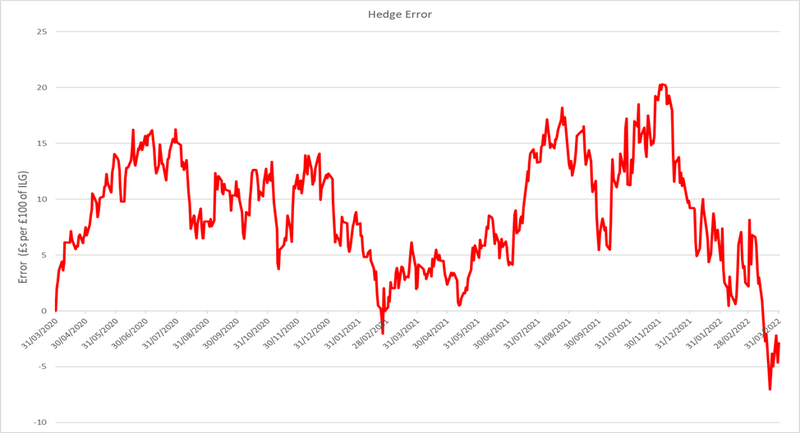
With an average error of £8.80 per £100 nominal of ILG, this dwarfs the average RPI effect of £3.02. The maximum positive error is £20.29, and the maximal negative error is £7.05. With an error term that is 2.7 times larger than the effect being hedged, this is simply not fit for purpose. Simply put, the use of ILGs will increase rather than reduce the volatility of deficits due to inflation.
On the other hand, the purchase of ILGs will serve as an imperfect hedge of gilt prices and yields determining the discount rate applied to liabilities. Over this two-year period, this hedge has been between 80% and 114% of conventional gilt changes.
This raises questions for the USS statement that they are 28% hedged for inflation and 34% hedged for interest rate effects. With £20 billion committed to inflation indexed securities in 2020 and £30 billion in 2021, this is a material concern. If the 34% interest rate coverage figure does not include the interest rate aspect of ILGs, it is grossly misleading. This has varied from as little as £16 billion in 2020/2021 and as much as £34.2 billion in 2021/2022. If the interest coverage figure does include the fixed income aspect of ILGs, then at the higher value it excludes any material role for the £5 billion of hedging instruments, mostly derivatives, reported in the 2021 accounts. It seems most probable that the interest rate effects of ILGs are simply omitted. If they are, then the true hedging of interest rate lies between 56% and 66% of scheme exposures at their self-sufficiency level, or much more at the valuation of technical provisions level. It is though clear that if USS move to 40% hedging of both self-sufficiency risk exposures, it is likely that they will be over-hedging the interest rate exposure at the level of technical provisions.
Final Thoughts
While USS has been used as a case study here, given the widespread use of ILGs in liability driven investment in defined benefit pensions, it seems almost certain that some will have omitted these considerations and be over-hedging the interest rate exposures of their liabilities. This has major economic implications for UK plc and the lacklustre productivity that has plagued the economy for well over 15 years now.
Of course, one thing that hedging by the purchase of ILGs and gilts (even synthetically through derivatives) achieves is that it embeds the use of gilts in the scheme’s discount rate selection procedure - and, the wisdom, relevance and suitability of using gilts-based discount rates has long been challenged.