Portfolio Resilience – The Transition To LDI II
Wednesday, 12 April 2023By Iain Clacher & Con Keating

Advocates of Liability Driven Investment (LDI) have been busy reassuring the authorities that LDI no longer constitutes a threat to financial stability. They have been doing this, in increasing volume and frequency since the end of the Bank of England intervention in the gilt market in October last year: It is worth considering one aspect of the extent of leverage by schemes, borrowings under repo.
The ONS reports scheme repo as having risen from £192 billion at the end of December 2021 to £202 billion at the end of September 2022. While the ONS indicates that borrowing had fallen from the £207 billion outstanding at the end of June, the overall long-term trend had been a steady and persistent increase. The Bank of England monetary statistics[i] give us a fuller, more detailed level of insight, though only into the activities of the monetary financial institutions making these reports – basically authorised banks and building societies. There are of course other participants and sources of finance in the repo markets, notably the investment banks and hedge funds.
M4 lending to other financial institutions is shown in Figure 1 below.

Figure 1 M4 Lending to other financial institutions
The rise in lending from August 2022 is large but not in itself remarkable. However, the decline after September 2022 is stark: £23 billion in each of October and November 2022, and continuing to decline until the end of February 2023, by which point it is down by a total of £87 billion from the September 2022 high. By contrast, in these monetary statistics, M4 lending to pension funds by banks, shows a rise of £3 billion in the August/September 2022 period and this then declines from the height of £37 billion to £22 billion at the end of February 2023, a decline of some £15 billion.
M4 lending to fund management activities, presented in Figure 2 below, shows an abrupt decline after September 2022. Having been steady in a narrow range around £140 billion, it falls abruptly and continuously by £53 billion, to the end of February 2023 value of £87.7 billion. While some of this decline may be attributed to the ending of repo lending to pension funds, it seems likely that most or even all of it was deleveraging by the pooled LDI fund sector.
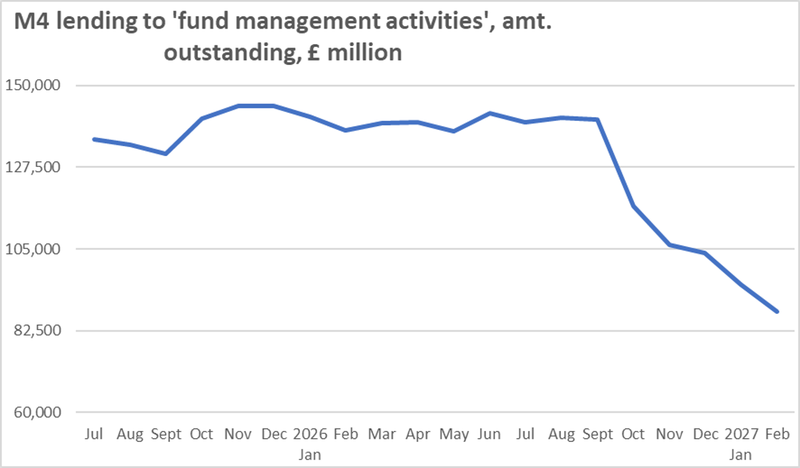
Figure 2: M4 lending to fund management activities
These statistics are consistent with the narrative that pension funds were complacent and satisfied with their LDI borrowing and maintained their positions until the September crisis hit. It is equally possible that trustees were largely unaware of what was being done in their name.
By contrast, there are no noticeable increases or decreases in lending to the private corporate sector, which implies that the extent of borrowing by schemes from their sponsor employers was limited and most likely met, where it happened, from their existing corporate cash resources.
Deleveraging
It is clear that significant deleveraging by pension funds has taken place, but it needed to, as at the end of September 2022, leverage was 18.2% of schemes’ much depleted assets. Note that this is not the overall leverage, which would involve consideration also of the derivatives exposures of schemes, for which we know only that it was substantial. The declines seen in repo exposure shown in the monetary statistics, 38% - 40% of the pre-crisis outstanding, would, if repeated across all sources of repo finance, leave repo leverage slightly above its 10.5% level at the beginning of the year.
Based on the ONS data, schemes sold some £18 billion of corporate bonds and £33 billion of equity over the nine months to the end of September, a total of £51 billion raised. Over the quarter ending September 2022, just £4 billion of conventional gilts were sold. The rebalancing since, as captured by these monetary statistics, suggests that sales to a somewhat greater value have taken place, perhaps around £68 billion. The question which must then be asked is which assets were chosen for sale. It is worth noting that the £19.3 billion of assets, sold to the Bank of England during their intervention, have been repurchased by pension funds – at a net loss to the sector of £3.8 billion.
This concern is more than academic. If yet more high yielding assets have been sold, there must be doubt as to the feasibility of the residual asset portfolio now being capable of delivering the returns needed to support the higher discount rates in use.
It is highly likely that during the crisis schemes sold what was easiest to sell, their most liquid assets – the net result being that schemes were not only smaller but also proportionately invested in less liquid assets. USS for example reported an increase in its proportion of private investment from around 30% at the beginning of the year to around 45% at the end of September.
If, as seems likely, the majority of the reported M4 fund management declines were due to pooled fund activities, then it is gilts which will have been sold, and in some minor cases, small amounts of corporate bonds. The £15 billion decline in segregated or own management borrowing is a very small fraction of the total outstanding of £202 billion. This could have involved the sale of any of the assets of schemes. The timing of the changes evident in these monetary statistics casts doubt over the assurances, in both timing and amount, that schemes have been rebalanced and are now resilient to 300 or 400 basis point changes in yields. It is also evident that this activity will have ongoing consequences in terms of costs for schemes.
Final thoughts
Regrettably there is no available data on DB pension schemes’ use of interest rate derivatives, before, during, or after the gilt crisis. Anecdotally, it appears that this was far larger than the use of explicit borrowing.
If the indications evident in this monetary dataset hold true for derivatives, the de-levering of the sector is far from complete and may not even be half finished. We must look to the ONS release of the December survey results for the answers to some of these questions. In the interim, we may gain some insight from the Bank of England’s monetary statistics.
By way of ending, we will note that the contraction in the broad M4 lending statistics is more than accounted for by these LDI effects and that it is far from obvious that monetary contractions of this type will have the same deflationary effects as, for example, contractions in consumer credit.
[i] We are indebted to Geoff Tily, Chief Economist of the TUC and author of Keynes Betrayed, for insights into the relevance of the Bank of England Monetary Statistics and the use of his data.