Risk & Defined Benefit Pension Scheme Funding
Thursday, 24 March 2022By Iain Clacher & Con Keating

We were recently asked to review the proposed investment strategy of a major pension scheme, which involves funding to the level of ‘self-sufficiency’ and ‘de-risking’ of the fund and using leverage to achieve this. As part of our preparation for that we decided to read many of the recent industry publications advocating these approaches. Of course, though often dressed in academic clothes, these publications are marketing documents. [or Dilbert says it all]
Surprisingly, in these publications, it is not uncommon to find factual errors.
“It is a regulatory requirement to link the discount rate to a market-based rate of interest, such as long-term gilt or swap yields thus, as these yields change the value of a scheme’s liabilities will also change.”
Though regulations do permit the use of a market-based discount rate, this statement is not actually true. Moreover, a scheme’s liabilities, the projected future benefit payments are unaffected by the discount rate in use. Interest rates are not a factor determining the future amounts of DB pensions. The principal factors which determine these amounts are the accrual/award rate, longevity, and price and wage inflation. Yet we see explicit misstatements such as: “If long-term interest rates (i.e. yields) fall, then a pension scheme’s liabilities will rise.” It is the present value of liabilities, not the liabilities themselves which vary, and while some may think that this is an issue of semantics, it is not, it has huge economic consequences.
The discount rate being employed will not in and of itself affect the cost of provision of the ultimate pension benefits payable; it is only if interventions e.g., deficit repair contributions, are made based on the present values derived that additional costs are introduced. From this perspective, liability driven investment is misconceived. By contrast, management of the real risk factors of DB pensions, inflation, longevity etc., is desirable.
It is interesting that some papers describe the present value as the “market value”. Even though a market related discount rate may have been used in the derivation, this value is not a market value. Indeed, if we could derive market values in this way, equities would be traded (or not) on the basis of the net present value of their projected dividend payments and the investment services industry would shrink to a small fraction of its present size.
There are also examples of some acknowledgement of the independence of liabilities from the discount rate: “Note that although interest rates affect the present value of a scheme’s liabilities, i.e., the amount of money required to be held today, interest rates and changes to interest rates have no impact upon the actual amount paid out. Compare this with inflation which affects both the (inflation-linked) amount paid as well as the present value of the liabilities.” But even this confuses interest and discount rates. If the discount rate used is, for example, the expected return on assets, there may be no sensitivity to interest rates at all.
But the confusion continues: “The discount rate is linked to long-term market interest rates. If long-term interest rates fall, the actuary will assume a lower rate of return on scheme assets which means we need more money today to meet our liabilities in the future, essentially the present value of the liabilities increases.” This is only true if the actuary is tying the future returns on scheme assets to those long-term rates. Unless the scheme assets consist solely of these fixed income securities, there are good reasons not to do this. For example, the profitability of the private non-financial sector, in general, increases as interest rates decline, and with those changes the capital value of their equity increase. This is evident in Figure 1 in the period to 1999.
Figure 1
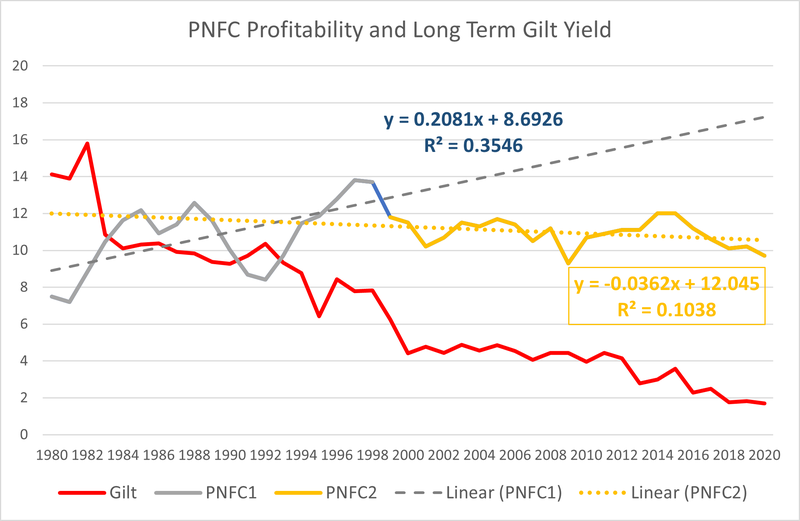
It is interesting that the change in behaviour evident after 1999, the minor decline in PNFC profitability trend, is itself a result of pension accounting and regulation. If we adjust these figures to reflect the costs of deficit repair contributions made during the period, the positive relation is again evident.
The most important point though is that if we introduce a hedge of movements in the discount rate into the scheme, we are introducing a new sensitivity for the scheme. This, inevitably, has a cost – of the order of 1% p.a. for typical approaches. It may be that this is the lesser of two evils, in that this may be less than the costs of deficit repair contributions erroneously required as a result of an inappropriate discount rate.[1]
Reckless Prudence
Many of the industry publications draw a distinction between rewarded and unrewarded risks. “Broadly speaking, the main unrewarded risks pension schemes face are interest rate risk and inflation risk. Liability Driven Investment products are designed to minimise a pension scheme’s exposure to these unrewarded risks.” This is a spurious distinction, though it is correct to see interest rate risk as unrewarded, as it does not exist within a DB scheme. It is not a factor determining the pensions ultimately payable. The assumptions of the values of the factors which drive the projections of future benefits payable, such as inflation, are not unrewarded in any meaningful sense. If the experience of inflation is lower than the assumption made in the projections, then the realised cost of those benefits will be lower than was projected, that is rewarded. We should note that the benefits ultimately paid do not depend on the assumptions made about them but do depend on the experience over the life of the pension. Over the life of a pension, assumptions and experience will converge to experience alone.
Conservative or ‘prudent’ assumptions will converge with the realised experienced and in doing so would throw up surpluses. Some true but incomplete statements are also made, such as: “a scheme that is 100% funded would in theory be able to meet all its future liabilities.” This is true of any scheme for which the expected rate of return on assets is used as the discount rate, and that may be a high or a low rate depending upon the assets held.
Over the past twenty years, it seems to have become orthodoxy to believe that schemes may be ‘de-risked’ by the use of ever lower discount rates and increasing amounts of contributions to achieve higher funding levels. This is misconceived. Increasing the level of funding of a scheme will, ceteris paribus, raise the riskiness of the fund. Simply put, there is more money at risk of loss.
We shall illustrate this situation for a scheme using a single high and a low discount rate, respectively 6% and 1% pa (Figure 2). We show the pension benefit projections (as grey bars) together with the trajectories of the discounted present values of the cash flows of these liabilities (as red and blue lines)
Figure 2
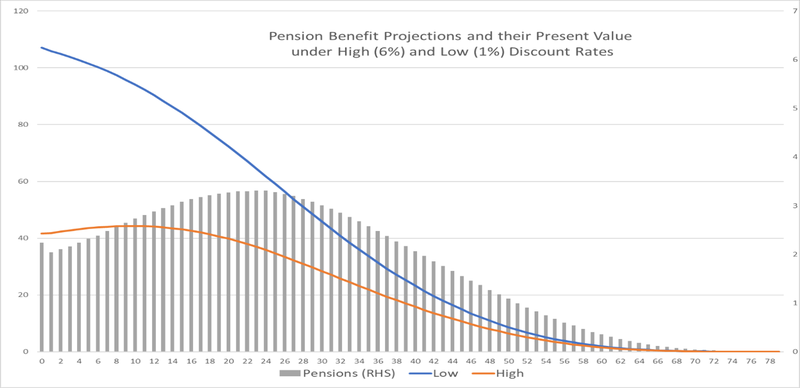
The risk of the fund is directly related to these funding levels; they are the amounts exposed to the risk or volatility of the fund. The high discount rate present value is £41.6 million, and for the low, £107.1 million. We next show (Figure 3) the spot and future risks of the high and low funding trajectories for a selection of fund volatilities; ranging from 5% to 14% (in shades of green) for the low discount rate trajectory and 14% and 20% for the high discount rate trajectory (shades of red).
It can be seen that only the 5% investment volatility strategy results in a lower risk across the entire trajectories at both 14% and 20% volatility. Higher funding levels require lower volatility strategies if they are to ‘de-risk’ a scheme.
Figure 3
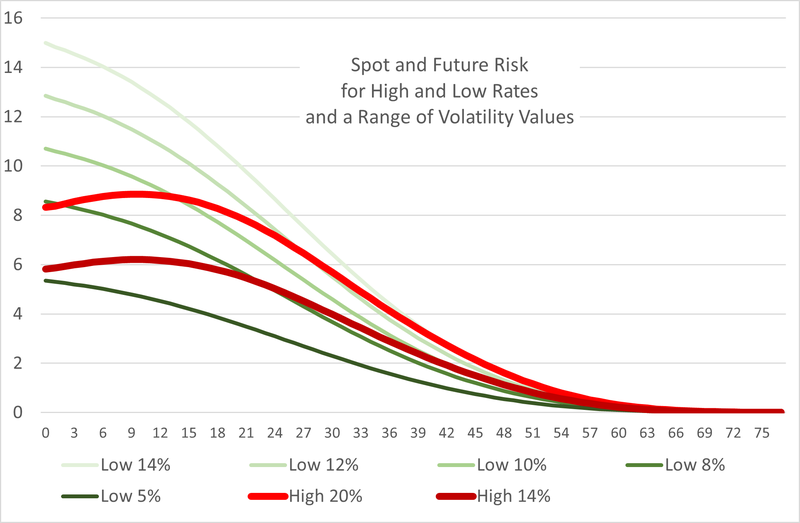
In this illustration the low discount rate strategy has an immediate cost relative to the high of £65.5 million. It is worth thinking on the productivity of committing this amount of funds immediately and considering how much of the future risk would need to materialise for the contributions of the scheme sponsor to be higher than this. For the 14% volatility case, this is 45 years if all of these risk outcomes were to materialise (a most unlikely circumstance). The subsequent “advantage” to the lower volatility scheme is just £6.12 million in undiscounted future value terms. In discounted present value terms, the immediate cost of £65.5 million is never fully recovered even under this extreme assumption of the risk exposure being realised in each year.
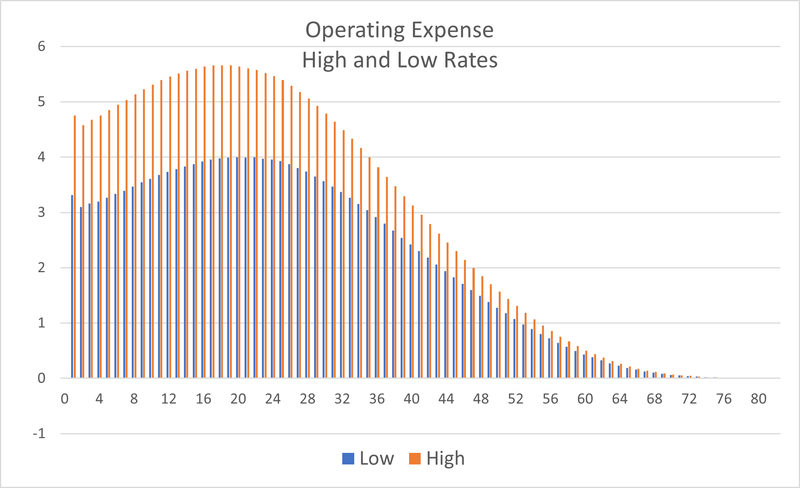
The cost-benefit analysis is not attractive for the low discount rate valuation. The operating expenses of the scheme, the sum of the pensions payable in a year and the accrual of the value of the fund in that year are shown in Figure 4. The low discount rate operating expense averages 75% of the operating expense of the high discount rate expense but costs 257% of the cost of the high discount rate approach to implement.
Figure 4
In addition to this, of course, the higher contribution cost to the employer will have weakened their finances and covenant strength making the scheme explicitly riskier, as the sponsor has been weakened. In the current regulatory regime, this would likely lead to some additional considerations and mitigations to be put in place for the Regulator to be satisfied. Despite the fact that the approach taken is one the follows very closely the prescribed approach of the Regulator.
The lesson here is that reckless ‘caution and prudence’ in scheme funding can be counter-productive and ultimately make schemes riskier.
Leverage
The other theme common to most of the ‘de-risking’ strategies, beyond the segregation of assets into hedging or LDI assets on the one hand and growth on the other, is the use of leverage by the scheme. It is worth noting that regulation precludes the use of leverage by a pension scheme other than for liquidity and risk management purposes. This matter is vast in scope and will be the subject of a subsequent blog; here we will restrict ourselves to considering some of the more common proposals and claims made.
As a start point, it should be recognised that leverage may be achieved on two distinct ways; by explicit borrowing by the scheme to finance the purchase of ‘hedging’ assets or by acquiring assets which are internally leveraged. Some examples of this latter situation are interest rate (or other) swaps, as well as futures and options contracts. Similarly, investments in hedge funds are usually leveraged within the fund. The risk exposure of such derivatives is the notional value of the contract and that far exceeds their price at acquisition.
A fairly priced interest rate swap has no cost at inception, but may entail exposure to hundreds of millions of ‘notional’ exposure; a future will entail only the initial margin cost, usually a single digit proportion of the notional exposure. By contrast the usual form of borrowing is ‘repo’ – that is borrowing, usually short term, by the sale and repurchase of high-quality securities. These are usually gilts as the ‘haircuts’ applied to other securities such as equities can be prohibitive. The exposures to the writers of all of these contracts, their credit exposure, is usually managed by the operation of variation margins or the posting of additional collateral.
There are though a few points to note. First, the counterparty to a repo agreement is a secured creditor of the scheme and ranks ahead of pension scheme members (they actually have possession of the asset). Second, the operation of margin and collateral calls may place strain upon the liquidity of the scheme, requiring forced sale of assets at unfortunate times. It may be that rising rates have led to a collateral call to match the scheme losses and that these are reflected in declines in liability values, but those declines are unrealised and immediately unrealisable. Third, the acquisition costs of these assets fix the cost of pension provision in the absence of other subsequent interventions. If the scheme is in financial hell, it is condemning itself to remain there. This cost finality is perhaps most easily recognised when the hedging instrument purchased is a buy-out. Last, the contractual form of leverage, swaps and derivatives, is opaque to scheme members and other observers; they do not appear in the balance sheet and the notes are rarely adequate for a full analysis. This can be a major deterrent for external parties to corporate actions, such as suppliers of further development capital for the sponsor company.
From our readings, it appears that the most common recommended LDI portfolio structure is two thirds growth assets and one third LDI ‘hedging’ assets, with these assets being twice leveraged resulting in a scheme which is 1.667 times leveraged.
The stylised balance sheet for such a scheme would be:
Table 1 Illustrative LDI Portfolio Structure
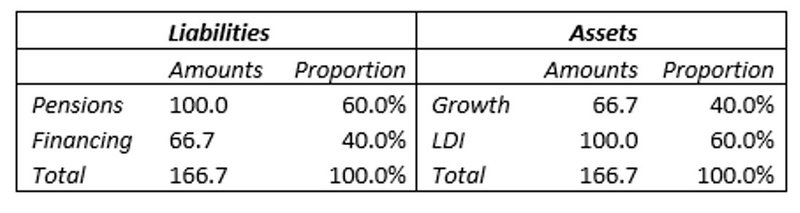
It should be noted that there is an embedded discount rate in this balance sheet. For the LDI assets to have the same value as the pension liabilities, if the hedging is to be complete, they must have the same expected return and structural characteristics as are embedded in the discount rate and assumptions of the projected benefits. If the hedging is complete, this balance sheet reduces to a hedge fund with no equity and growth assets (66.7) entirely financed by short-term debt (66.7). This is intrinsically unstable.
It is often claimed that these leveraged LDI strategies reduce the risk of the scheme. This runs counter to elementary financial theory where leverage increases, and in some instances is purposefully used to increase, risk and return.
Let us suppose that the hedging strategy covers only 80% of the risks of liabilities, then we may consider 80% of liabilities defeased, that is fully offset. From this, a reduced form net balance sheet can be produced. Here, the scheme will then have a deficit of £20. It has Pension liabilities of £20, Financing liabilities of £66.7 and (Growth) assets of just £66.7.
By way of ending, we would raise the question of timing with these strategies. Index linked gilts are a significant element in these LDI strategies, but the most recent fifty-year linker offered a return of RPI minus 2.38% pa. On those terms the purchasing power of this investment at its maturity will be just 30% of today’s value. The sharp recent rise in inflation would need to persist for more than a decade to offset that decline. Similarly, since April 2020 twenty-year conventional gilt yields have risen from 0.5% to 1.84%, resulting in a loss approaching 25% of its value over that time.
Concluding remarks
The obvious question with all of this is: what is the position of the Pensions Regulator, and with this in mind we asked a number of schemes to tell us their impressions of the position of TPR. The position of the Regulator is limited by the Pensions Schemes Act 2004 and Scheme Funding Regulations. Simply put, The Pensions Regulator could only lawfully intervene if the trustee has acted outside the range of prudence.[2]
However, we have been aware for some time of the emphasis being placed upon hedging in TPR’s recent Annual Funding Statements (AFS). For example: from the 2020 AFS, “Interest rate hedging was positive for schemes over the three-period to 31 December 2019 and the three-year period to 31 March 2020.”
This result is hardly surprising. The so-called hedging in fact is an open long position on gilt yields which have been falling since the early 1980s. Indeed, when a ‘hedge’ generates profits, this is a sign that something is amiss. Simply put, the goal of hedging is not to make a profit from the hedge itself, that is not the purpose of proper risk management.
To quote one respondent: “The mood music was emphatically always to hedge and to fund more and more. The tone of their engagement teams was not the avuncular Dixon of Dock Green, rather more Commander Kenneth Drury’s: “Pay up or we’ll fit you up.” TPR would, of course, deny it if challenged.”
Another reminded us of the fact that TPR has a statutory obligation to protect the PPF and higher funding for all schemes is unconditionally good in that regard. However, while this has been a job well done for the protection of the PPF, it has been a disaster for members, UK plc, and the real economy.
Notes
[1] We have written extensively elsewhere on the correct discount rate, the contractual accrual rate, for scheme evaluation. See for example The Design & Operation Of Collective Defined Contribution Pensions
[2] Section 123 of, and Schedule 10 to, the Pension Schemes Act 2021 will require the trustee to produce a funding and investment strategy document. The content of this document will, in part, be specified in regulations. But we are not aware of any draft regulations being put out for consultation.