Sawtooth/Sharktooth Ratings - Discrete Letters Versus Continuous Risk (Rating Agencies)
Saturday, 11 April 2026By Professor Michael Mainelli
Abstract - this article argues that alphabetic credit ratings contribute to financial instability compared with continuous numerical scales. Dominant credit rating agencies use discrete letter grades that invite negotiation, clustering issuers near grade boundaries. Drawing on a classroom grading analogy and simulated distributions, the article shows how such 'bunching' makes downgrades more likely following economic shocks, as many issuers sit just above a threshold. Alphabetical systems also obscure evaluative precision while retaining commercial flexibility under issuer-pay models. The piece does not challenge the existence or influence of rating agencies, but questions why judgments about continuous risk are expressed through discrete alphanumeric bands rather than transparent numerical scores.

In 2006 I explained to a bond trader that a source, albeit small, of financial instability could be attributed to the use of letter ratings - letter grades, a categorical ordinal rating system - rather than a continuous numerical scale. I encountered that trader at the end of 2025 and he reminded me I’d promised to write this up. Here’s a twenty-year late explanation.
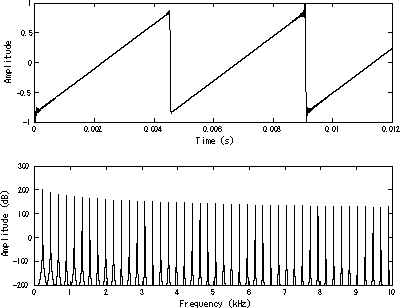
It started with an explanation on a bar napkin of sawtooth charts for time series. I was trying to explain that sawtooth charts for time series are fine, but are unusual for distributions. I then drew an imaginary line of sandboxes with different distributions across them and within them. In fact they tend to look more like sharktooth/sharkteeth ratings. Just to confuse you further with analogies, the original working title for this article was, "Statistical Alphanumeric Aberrations: Tights In The Ladder" as you could see bunching across the sandboxes if you looked at them vertically(!).
Ordinal data — where categories have a meaningful order but unequal intervals — is frequently misused across fields like finance, social science, education, and healthcare when analysts apply quantitative methods such as averaging or regression to it. Common examples include treating Likert scale responses, grades, and pain scores as if the gaps between values are mathematically equal, leading to inaccurate statistics and potentially flawed decisions.
In between 2006 and 2026:
“The three credit rating agencies were key enablers of the financial meltdown. The mortgage-related securities at the heart of the crisis could not have been marketed and sold without their seal of approval. Investors relied on them, often blindly. In some cases, they were obligated to use them, or regulatory capital standards were hinged on them. This crisis could not have happened without the rating agencies.”
[Financial Crisis Inquiry Commission report of 2011, see this note,[6]]
This quote underscores the importance of the three rating agencies, widely believed to hold a 95% market share in the West. UK market share for the big three is 92%, broken down as:
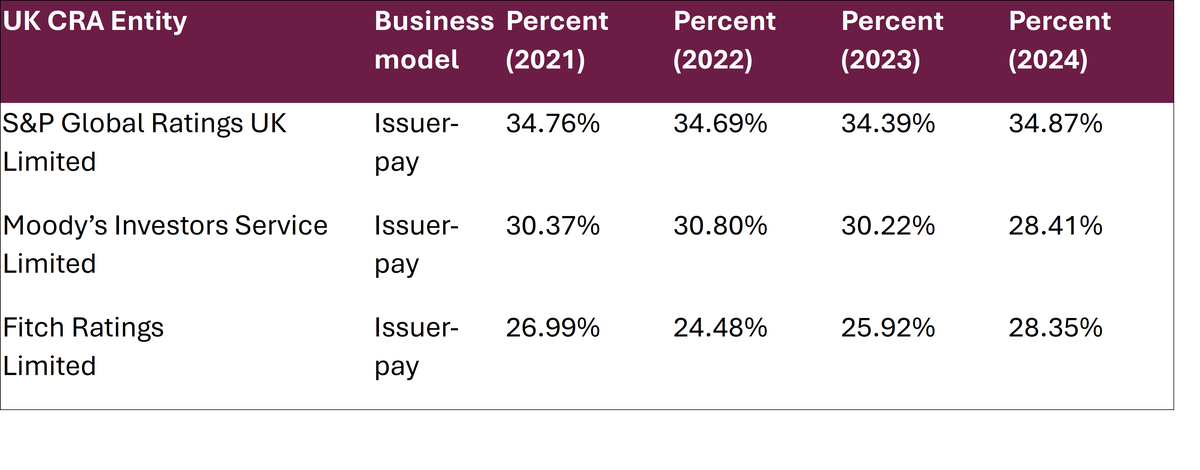
Source: FCA (2025) - https://www.fca.org.uk/publications/corporate/cra-market-share-report-2024.
All three rating agencies use alphabetical grades. Three reasons are commonly provided for the use of alphabetical grades:
- Ordinal Risk Ranking: Ratings are designed to rank risk relative to each other (e.g., AAA is less risky than AA), rather than providing an exact probability of default – though this seems a bit of strange reasoning, almost to the point of evading evaluation of default outcomes against predicted defaults;
- Stability Over Time: Alphabetic grades are meant to be ‘through-the-cycle’, meaning they change less frequently than a numerical score might, providing long-term consistency – this reason seems strange, almost as if the daily temperature is always specified as 22C regardless of the temperature, and then individual rooms are measured as the difference from the reference room, or perhaps we’re missing the science here?
- Qualitative Analysis: Determining a credit rating involves analysing complex, non-numerical factors like management quality, operational risk, and market outlook, which are difficult to quantify on a simple 1-100 scale – and how is a more complex structure better to quantify things? Though this argument touches on the nub of another deep problem, ratings require quite a bit of judgement.
Most of us are conditioned to think of 'A' as good, 'D' as bad, thanks to many other rating examples, not least of which would be how we were evaluated in primary and secondary school education. These credit rating agency alphabetical grades, non-numerical rating systems, are Moody’s Aaa to D (21 grades), S&P AAA to D (22 grades), and Fitch AAA to D (22 grades). They come with emotional impact as well. Unlike a continuous numerical scale, we see 'AAA' and think 'really really good', not just 'better than AA'. This contrasts with personal credit ratings which are normally done on a numerical scale (though note that US FICO scores aren’t exactly normal either with a score range of 300 to 850).
Because ratings require judgement, and because the business model is that the bond issuer, typically a corporate or municipality or government, pays for the analysis, there is a lot of opportunity for cat-and-mouse analysis – “we know roughly where you stand, but have a bit of leeway to allow you to move up or down a grade based on our judgement.”
Why might alphabetical rating systems increase instability more than numerical ratings? There is the same opportunity to move things up or down numerically as well as by alphabetical grade, but these opportunities don’t come with discrete jumps from band to band.
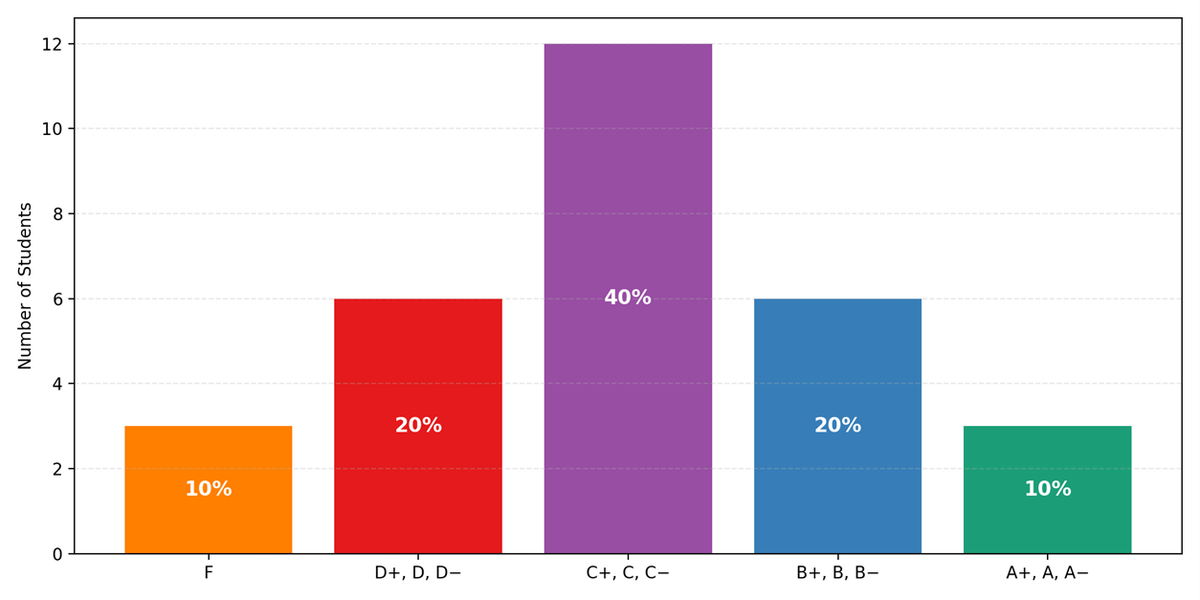
I once had a mathematics teacher who graded all exams numerically on the bell curve (normal distribution). He then distributed A’s to F’s proportionately to the normal distribution. It looked like this:
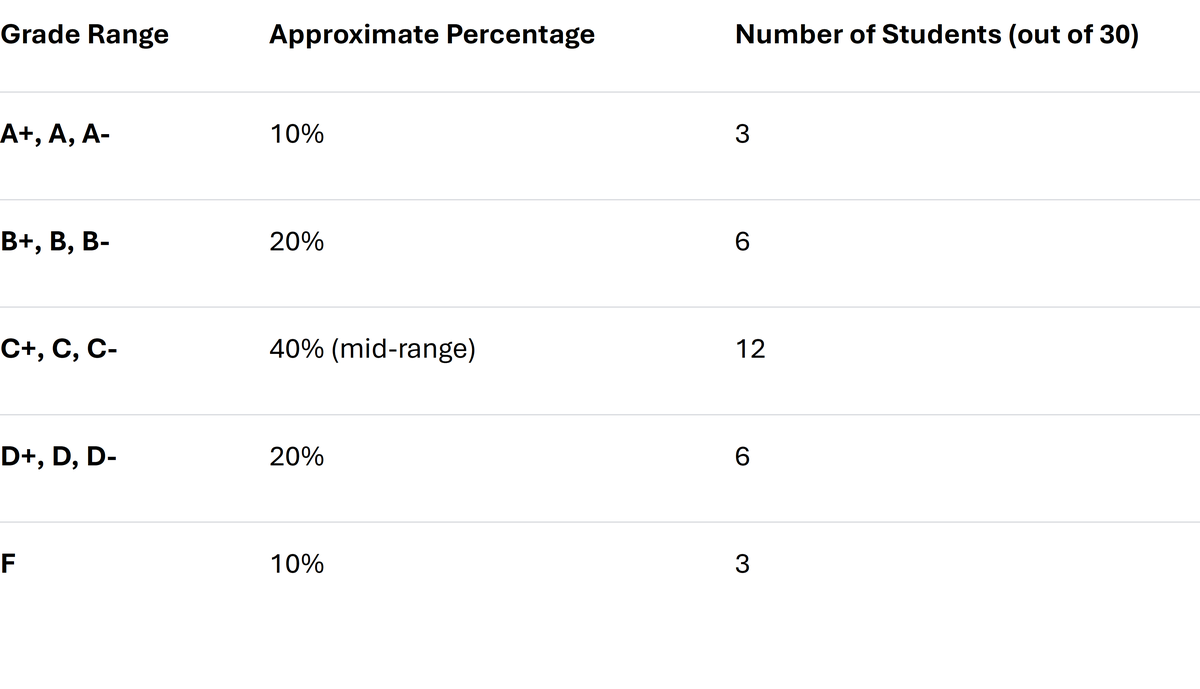
His scoring system was particularly harsh on Fs, which in those days really meant ‘fail’, so he’d frequently push two Fs up to D- in negotiation with either students, parents, or principal, and then play around a bit up the scale, making a few people a little bit happier. In truth, I suspect he would have preferred to just be numerical about the whole thing, but he had to comply with the prevailing grading environment. Here’s a simulation of one class:
Overall, his grades followed the spirit of the bell curve. However, by combining an alphabetic and a numerical system in each grade he was creating a non-normal mini-distribution which was weighted slightly towards the lower end of the grade band.
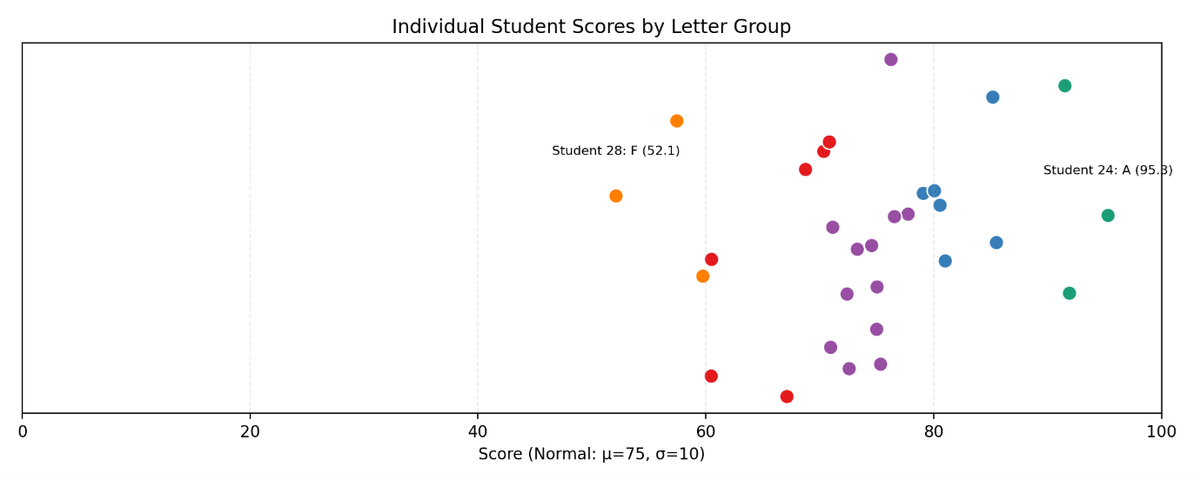
C grade group includes 12 students. Score range: 69.1–76.8. C scores look like this:
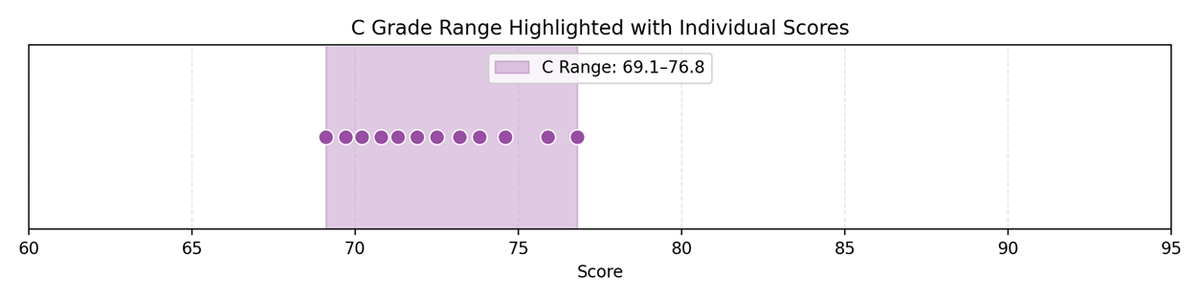
Each dot represents a student with a C grade. But by bringing up say two D’s into this range making 14 C students we would have two extra dots that create a cluster around 70. In other words, we are making the distribution more like a geometric than a normal.
Back To Credit Scores
Credit rating agency grades are part of a commercial process involving negotiation. The company, ‘issuer’, wants the best rating achievable given their current situation. There is negotiation on both sides. The credit rating agency has its reputation to consider. The credit rating agency needs to ‘sell’ its ratings, yet keep its reputation for accurate evaluation. The credit rating agency might wish to enter a market sector and be prepared to discount charges, or provide flexibility in ‘interpreting’ conditions.
Credit rating agencies do examine their own performance and publish some open papers and data, though often behind a subscriber paywall. The purpose of this article is not to examine their predictive capacity, their marketplace, or their regulation, just to probe a bit at a numerical scale rather than alphabetical one.
Companies that apply for ratings are unlikely to form a normal distribution. A company likely to be rated poorly will only do so if rating is mandatory for some reason. It appears from quick inspection of slightly old Moody’s data from 2016 (Jiang, page 10, Table 3) that ratings are not normally distributed. [Note Jiang’s conclusion – “Using Moody’s rating data from 2001 to 2016, I found that firms related to Moody’s shareholders were more likely to receive better ratings.”]
Let’s simulate 1,100 ratings in a uniform distribution spread into 22 compartments from D (left) to Aaa (right), each with 50 dots representing companies' numerical scores, with a few dots moving up from the compartment to the left. This simulation has dots stacked in 6 columns per compartment using geometric decay (p=0.25), to reflect that a number of companies are moving, just, into a higher rating grade due to negotiation. This negotiated movement creates more dots on the left columns and fewer on the right columns:
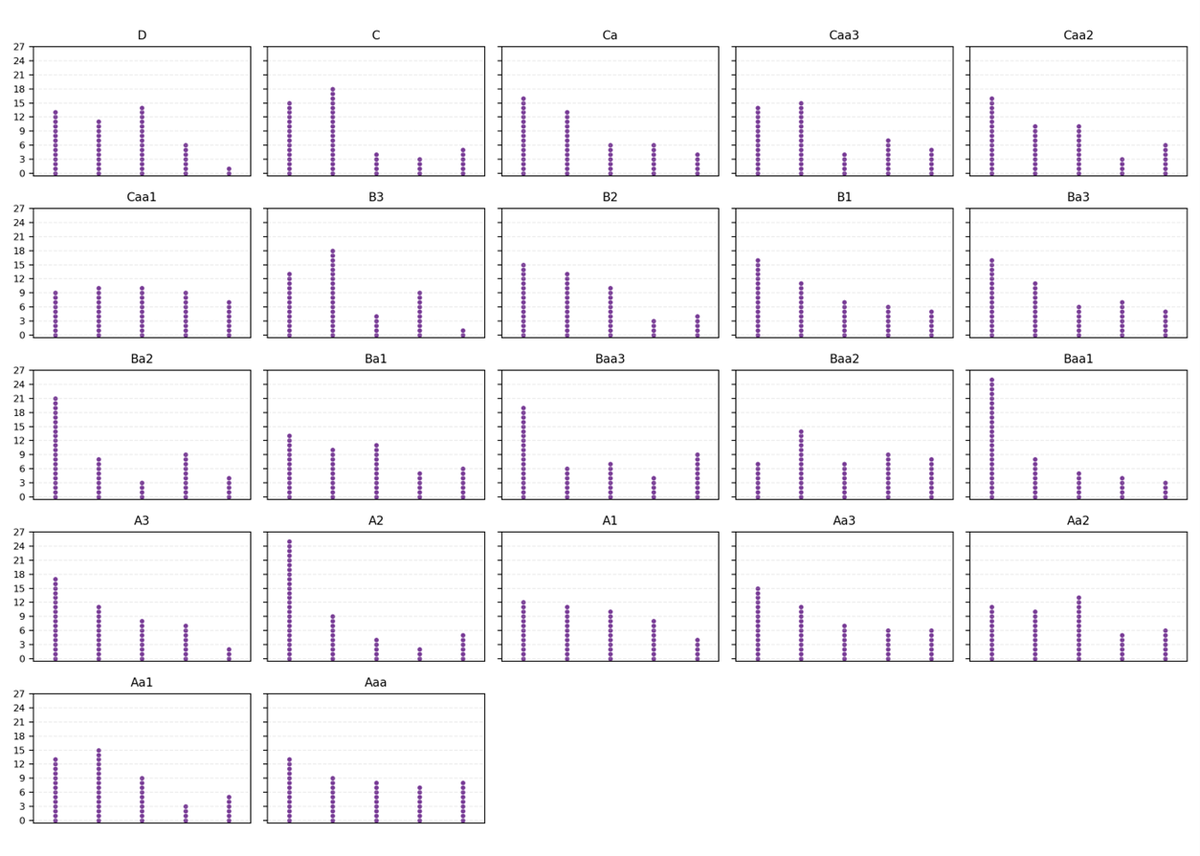
In other words, you can see the formation of the sawtooth distribution.
The relevance of this article is best made by considering what happens in the event of a negative economic shock. The clustering on the left in each compartment induced by negotiation means that the effects of an economic shock will disproportionately move companies down a grade because they have been ‘bunched’ on the left. This would not happen with a numerical rating.
As with most analyses, this note raises opportunities for more research. An examination of real-world events, looking at market reactions to downgrades across key rating thresholds versus rating changes that remain within a broader category, would be a sensible next step. That would help test the point that the real issue is not just the discrete structure itself, but the market consequences of crossing those boundaries.
Moody's KMV Expected Default Frequency (EDF) is a market-based, forward-looking credit measure that calculates the probability a public or private company will default within one year. Bloomberg DRSK (Default Risk) is a credit risk modelling tool within the Bloomberg Terminal that calculates the probability of default (PD) over the next 12 months for over 87,000 public and 433,000 private companies. Since EDF and DRSK provide continuous measures of default risk, analysts can compare continuous underlying risk with the discrete rating structure. For example, do firms with similar risk profiles end up separated by rating bands, or are firms just above and just below a threshold much closer in underlying risk than the letter grades suggest?
There are far greater issues with the overall credit rating system than just 'bucketing' - spurious accuracy, high back-tested volatility, gaming effects, bias, perhaps even incompetence. For this article, the first point is to point out to readers that an ordinal grading system is not to be admired, but seriously questioned. The second point is that the impact alphabetical discretisation leads to instability because of the weight attached to more attractive thresholds.
Once a lot rides on crossing from one band to another, even small differences in underlying risk can have outsized effects. Which leads us back to the core question – why don’t credit rating agencies rate corporate debt on a numerical scale?
Sincere thanks are due to Bill Joseph, Xenia Mainelli, Evgenia Gvozdeva of Russell Investments, and Kelly Mainelli of Russell Investments for inspiring this note without in any way lumbering them with responsibility for it - well, perhaps except Kelly.
Appendix - Ratings Compared
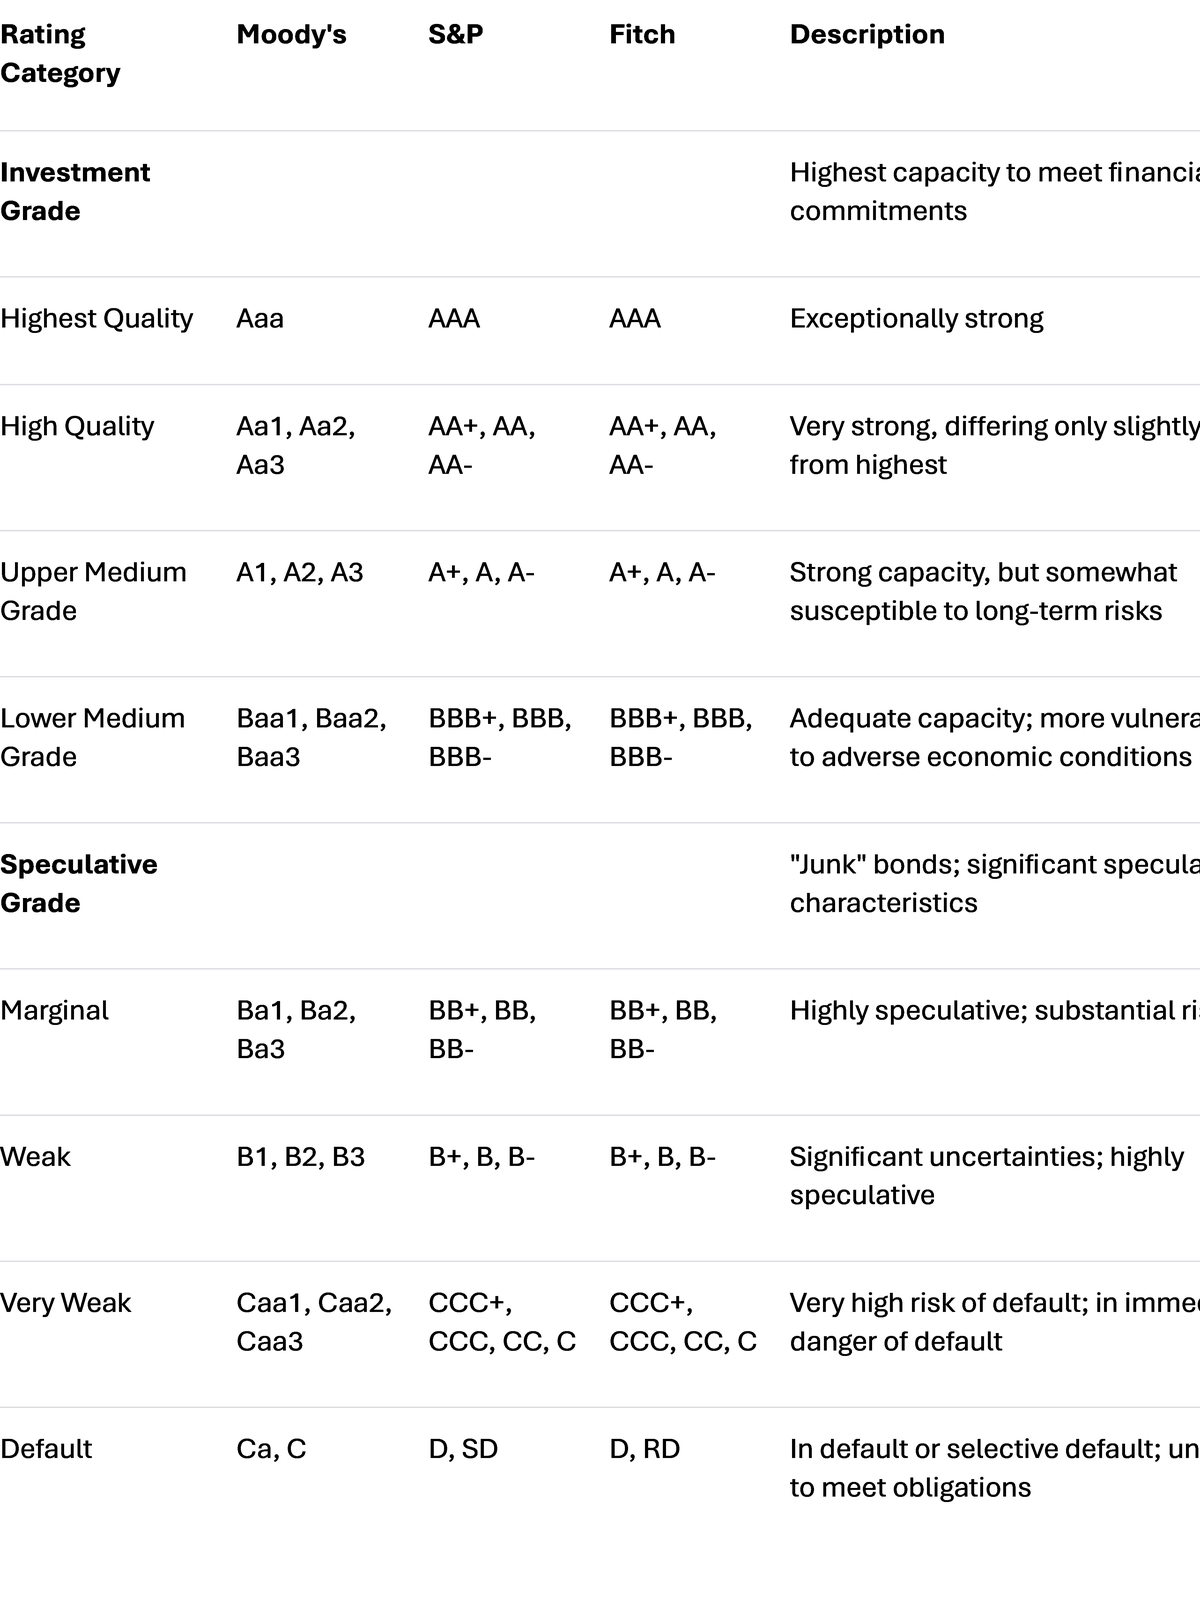
Key Differences in Notation
- S&P and Fitch use a very similar system with capital letters. They append plus (+) and minus (-) signs to indicate a bond's relative standing within a major rating category (e.g., A+ is better than A-).
- Moody's uses a different notation with both uppercase and lowercase letters and appends numerical indicators (1, 2, 3) to show its ranking within a category (e.g., A1 is better than A2, but still not as good as Aa3).
- The lowest ratings are D for S&P and Fitch (default) and C for Moody's.
Further reading: Jiang, Yixiao. 2021. "Semiparametric Estimation of a Corporate Bond Rating Model" Econometrics 9, no. 2: 23. https://doi.org/10.3390/econometrics9020023